

Where to Place a Stop-Loss: Four Chart-Based Methods
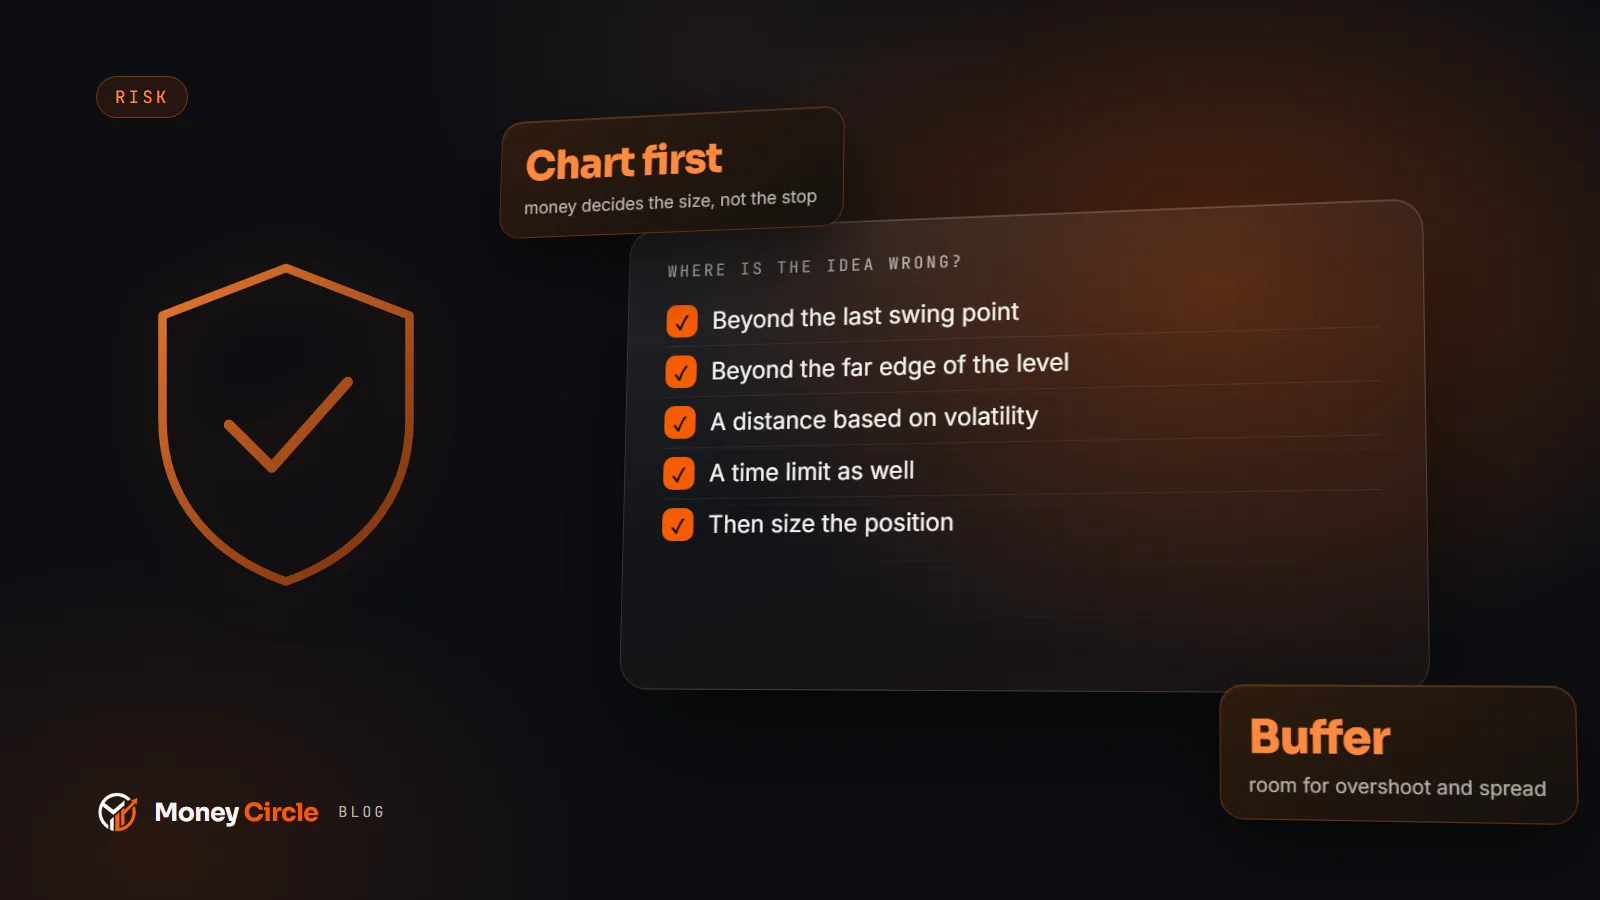
A stop-loss belongs where your trade idea is proven wrong, not where the loss feels comfortable. Four methods, and the mistakes to avoid.
A stop-loss is an order that closes a trade at a price you chose in advance. Everyone agrees you need one. Fewer people agree on where it goes, and that is where most of the damage is done: stops placed too tight get hit by ordinary movement, and stops placed too wide turn a small mistake into a large one.
This guide gives you a way to think about the placement, four methods you can test on a chart, and a short list of mistakes. It does not tell you what to trade or which way, and it is not a recommendation of any setting. The numbers in the examples are hypothetical.
The question a stop answers
A good stop answers one question: at what price is my trade idea wrong?
If you buy because price bounced from a level that has held several times, then a clear break back through that level means the idea has failed. The stop belongs just beyond it. If your reason for entering was a trend, the idea fails when the structure of the trend breaks. In both cases the stop is tied to a fact on the chart, not to an amount of money you are willing to lose.
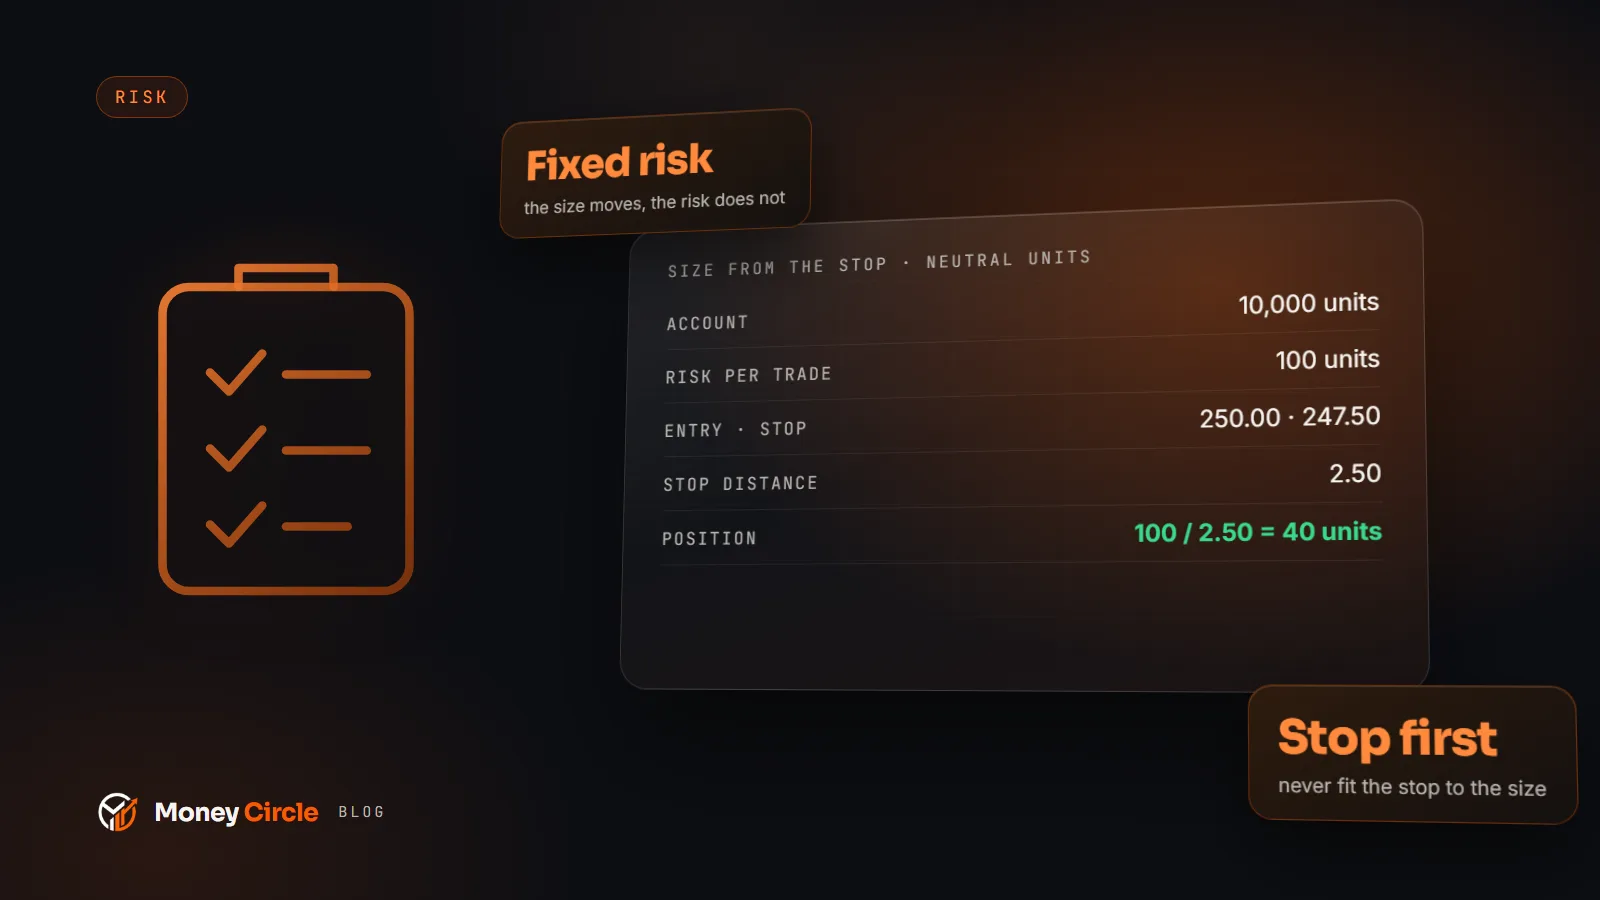
This is the opposite of the most common beginner approach, which is to pick an amount ("I can lose this much") and put the stop at the matching distance. Money comes into the picture later, when you choose the position size. The stop distance is set by the chart, and the size is then adjusted so that the distance costs you the amount you planned to risk.
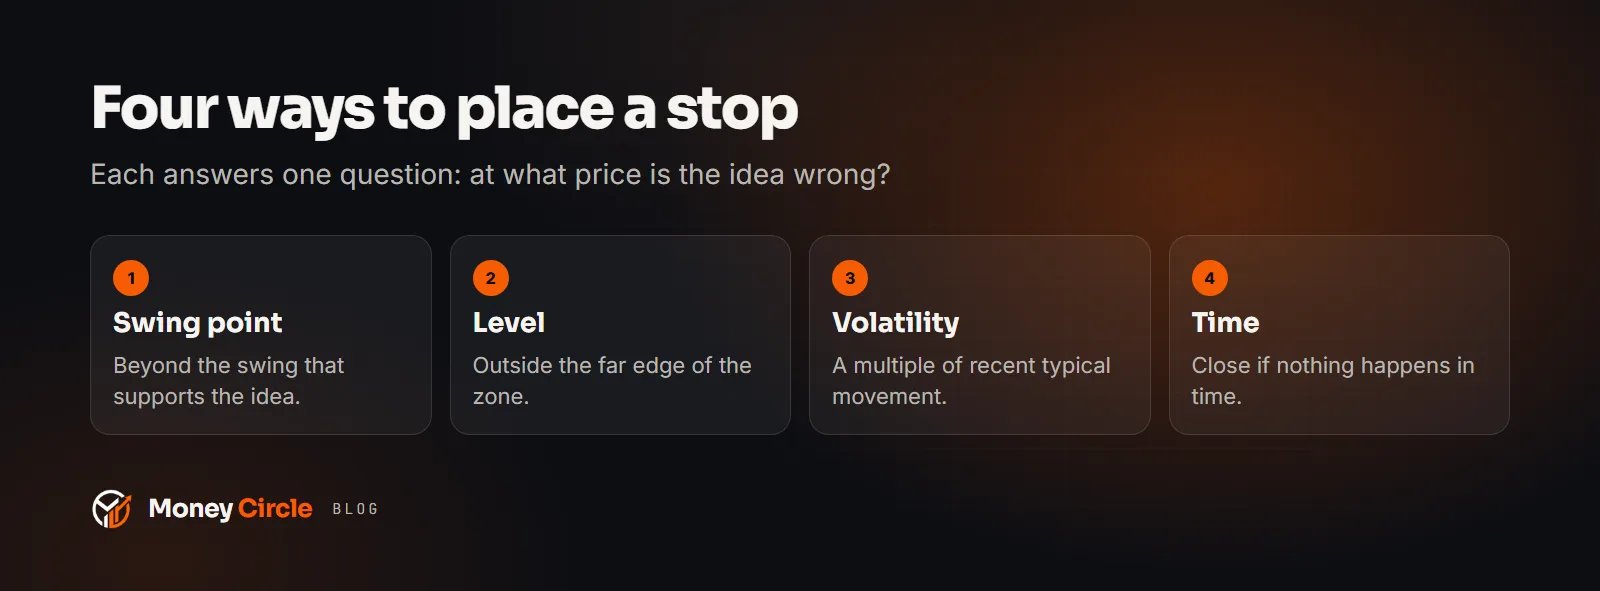
Method 1: beyond a swing high or low
The most widely taught method places the stop beyond the most recent swing point that supports your idea. For a trade that expects price to rise, that is below the last meaningful swing low. For a trade that expects price to fall, it is above the last swing high.
Add a small buffer so a brief poke through the level does not close you out. The buffer is a judgement. Look at how far price usually overshoots that kind of level on the timeframe you trade, and leave room for it plus the spread.
The strength of this method is that it is easy to explain: if price takes out the swing, the structure you relied on is gone. The weakness is that the swing may be far away, which makes the stop wide and the position small.
Method 2: beyond a level that has been tested
If your entry is based on support or resistance, the stop goes beyond the level, not inside the zone. Levels are areas more than exact prices, so draw the zone and place the stop outside its far edge.
A simple check helps. Count how many times price has reacted to the level, and look at how far it pushed through on the occasions it did. If the level has been tested many times, it may be about to give way, which is worth knowing before you rely on it. Our guide to why trading plans fail explains why writing down the reason for every level helps you avoid fooling yourself.
Method 3: a volatility-based distance
Markets move by different amounts at different times. A stop of fixed size can be generous in a quiet week and absurdly tight in a volatile one. A volatility-based stop adapts: you measure recent typical movement, for example with the average true range indicator that most charting platforms offer, and place the stop a chosen multiple of that away from your entry.
This does not tell you where the idea fails, so it is best combined with method 1 or 2. Use it as a sanity check: if your chart-based stop is much smaller than the typical movement of the last few days, it is probably inside the noise. If it is far larger, the trade may need a smaller size or a pass.
Method 4: a time stop
Some ideas are wrong because nothing happens. A time stop says: if the trade has not moved in my favour within a set number of candles, I close it. It sits alongside a price stop, not instead of one. It frees your capital and attention from trades that are going nowhere.
Write the time limit in the plan before the trade, because once you are in the position it is very easy to find reasons to wait.
A worked example (hypothetical)
Imagine a made-up market trading at 1,000. Price bounced three times from 980, and you plan a trade that expects the bounce to hold. Your entry is 984. Price has overshot 980 by up to 3 points on earlier tests, and the spread is 1 point.
The invalidation is a move below 980. Add the overshoot and the spread, and the stop goes at 976, which is 8 points from the entry. If your plan risks 40 units of account currency per trade and each point is worth 1 unit per unit held, the position size is 40 divided by 8, which is 5 units. If a 976 stop feels too far away, the answer is a smaller position or no trade, not a stop at 981 that sits inside the zone.
The numbers are invented to show the order of the steps: reason, level, stop, then size.
Mistakes to avoid
- Placing the stop at a round number. Many orders cluster at obvious prices, and brief spikes often reach them. Leave room beyond the round number or the swing.
- Moving the stop further away. Widening a stop because the trade is going against you removes the only protection you set up. Move a stop only in the direction that reduces risk, and only by a rule you wrote in advance.
- No stop and a mental stop. A stop that exists only in your head depends on you being at the screen and willing to act. Under stress, you will not be. Place the order.
- Ignoring gaps and slippage. A stop is a plan to exit near a price, not a guarantee of the fill. In fast markets or around scheduled news, the exit can be worse than the stop price. Allow for that when sizing, and read our piece on pre-market routines to see how checking the calendar first reduces surprises.
- Letting the stop decide the trade. If the sensible stop makes the trade too expensive for your plan, the trade is not for you today.
Test it before you trust it
Take twenty past setups from your own charts and mark where each of the four methods would have put the stop. Do not judge by profit. Judge by whether the stop sat at a price where the idea was truly proven wrong. You will find that one method suits your market and timeframe better, and you can then write it into your plan with a note of why.
Record every stop in your journal with the method used. After a month, you can see whether you were stopped out by noise or by genuine failure, which is exactly the evidence you need to adjust. Our trading plan template has a place for it, and the position size calculator turns a stop distance into a position size.
Trading involves risk of loss; a stop-loss does not guarantee an exit at the stop price, and this is educational content, not financial advice.
Educational content, not financial advice. Trading involves risk of loss.
Learn it, log it, review it on Money Circle
Included with every paid Money Circle membership: Trader Reflect and 2 ChartViews AI analyses a day.
Guides
Continue in the ecosystem
 ChartViews AI
 Trader Reflect
More from the Money Circle Blog
Get the free Trading Plan Template
A printable plan with your rules, risk and review routine, plus the weekly market outlook by email. Unsubscribe anytime.