

Risk-Reward Ratio Explained: What It Is and What It Is Not
The risk-reward ratio compares what a trade can lose with what it aims to gain. Learn to calculate it, and why it is only half the picture.
Almost every beginner course mentions the risk-reward ratio, and almost every beginner uses it slightly wrong. It is treated either as a magic number ("only take trades with three to one") or as something to ignore. It is neither. It is a simple piece of arithmetic that helps you decide whether a trade is worth taking at all, and it only works when you pair it with an honest view of how often your setup wins.
This guide explains what the ratio is, how to calculate it from a chart, why a higher ratio is not automatically better, and how to put it into a written plan. It is educational only and says nothing about any particular market or direction.
What the ratio actually measures
The risk-reward ratio compares two distances on a chart for one planned trade:
- Risk is the distance from your entry to your stop-loss. It is what you lose if the trade is wrong and the stop is hit.
- Reward is the distance from your entry to your target. It is what you gain if price reaches the target.
The ratio is a property of the plan before you enter, not a result. It tells you what a winner would be worth compared with a loser. It does not tell you how likely the winner is.
A worked example (hypothetical numbers)
Say a plan risks 50 units of account currency per trade, a made-up number. You take ten trades. In scenario A, your setup has a 1:1 ratio and wins five of ten. You gain 250 on the winners and lose 250 on the losers: you finish flat before costs. In scenario B, your setup has a 1:2 ratio and wins four of ten. Winners add 400, losers cost 300, and you finish ahead by 100 before costs.
These figures are invented to show the mechanism, not to suggest any real win rate. The point is the relationship: a lower win rate can still work with a larger reward, and a high win rate can still lose money if each loss is bigger than each win.
The break-even win rate
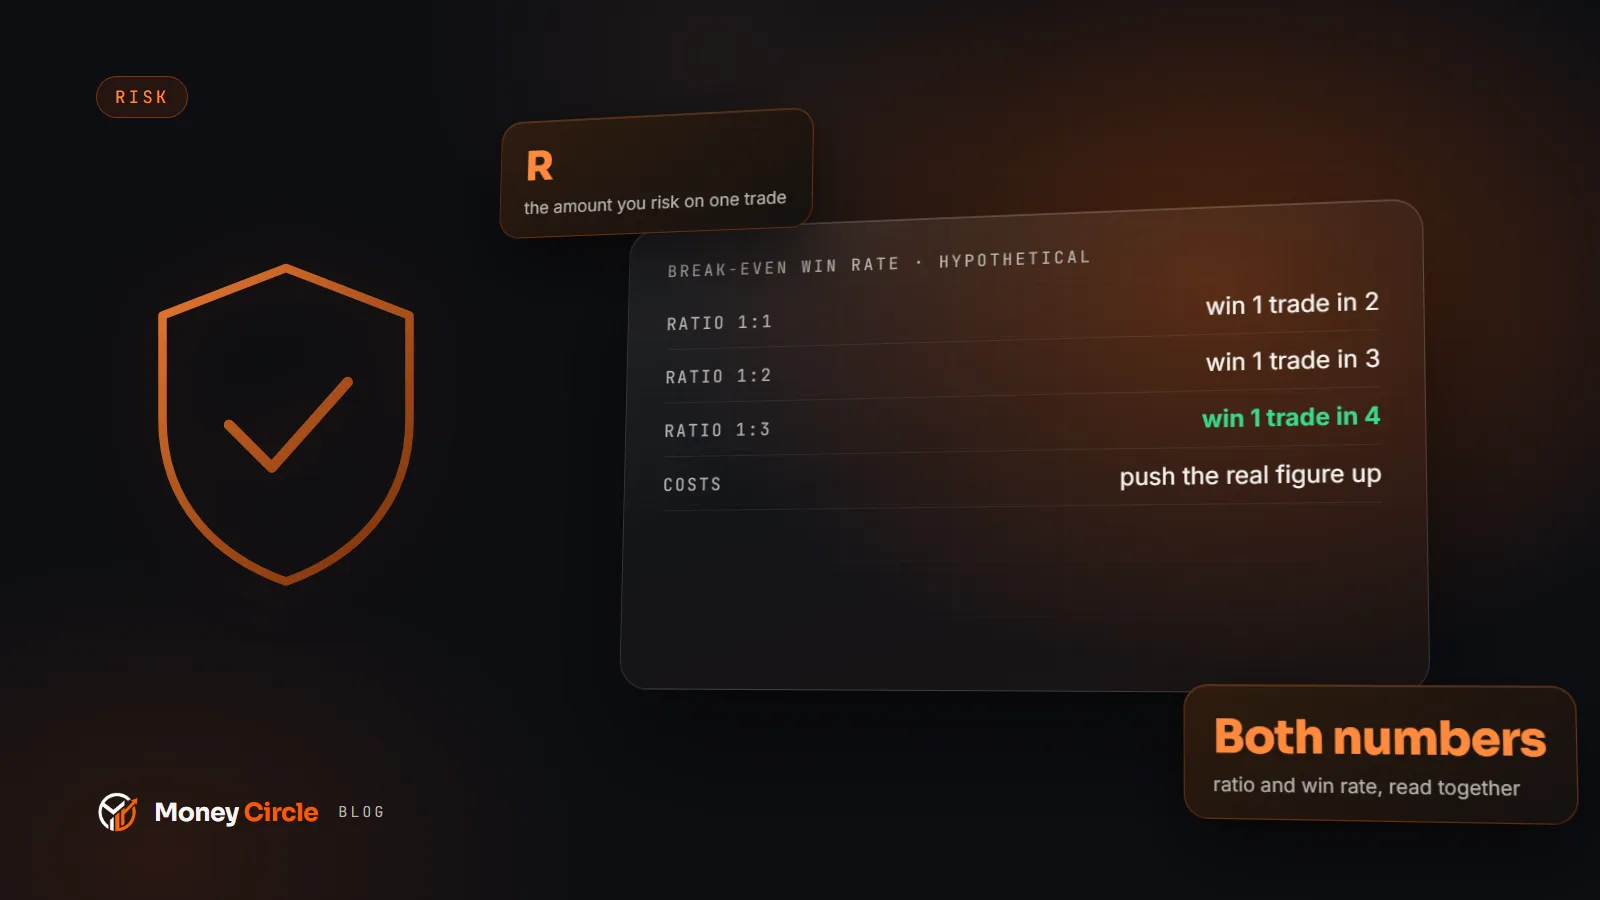
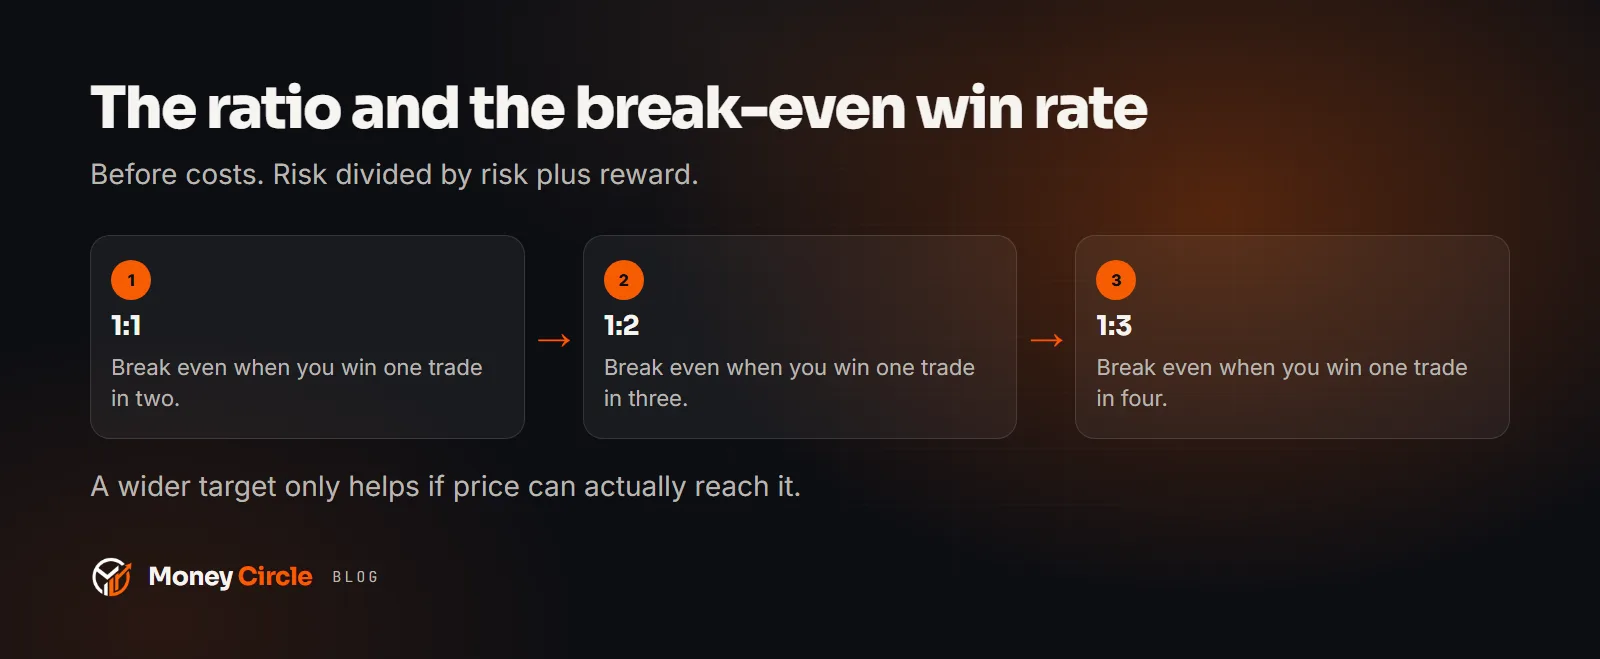
Every ratio has a win rate at which you neither gain nor lose, ignoring costs. You can work it out with one line of arithmetic: divide the risk by the sum of risk and reward.
- At 1:1, you break even when you win one trade in two.
- At 1:2, you break even when you win one trade in three.
- At 1:3, you break even when you win one trade in four.
Costs matter too. Spreads, commissions and slippage reduce each win and enlarge each loss, which pushes the true break-even point higher than the tidy figures above. When the stop is tight, costs are a larger part of the risk, so check them before you trust a ratio on a small chart move.
Why a bigger ratio is not automatically better
A common trap is to stretch the target until the ratio looks good. Move the target further away and the ratio rises on paper, but the chance of price reaching it falls. You have improved the number you can see and damaged the number you cannot.
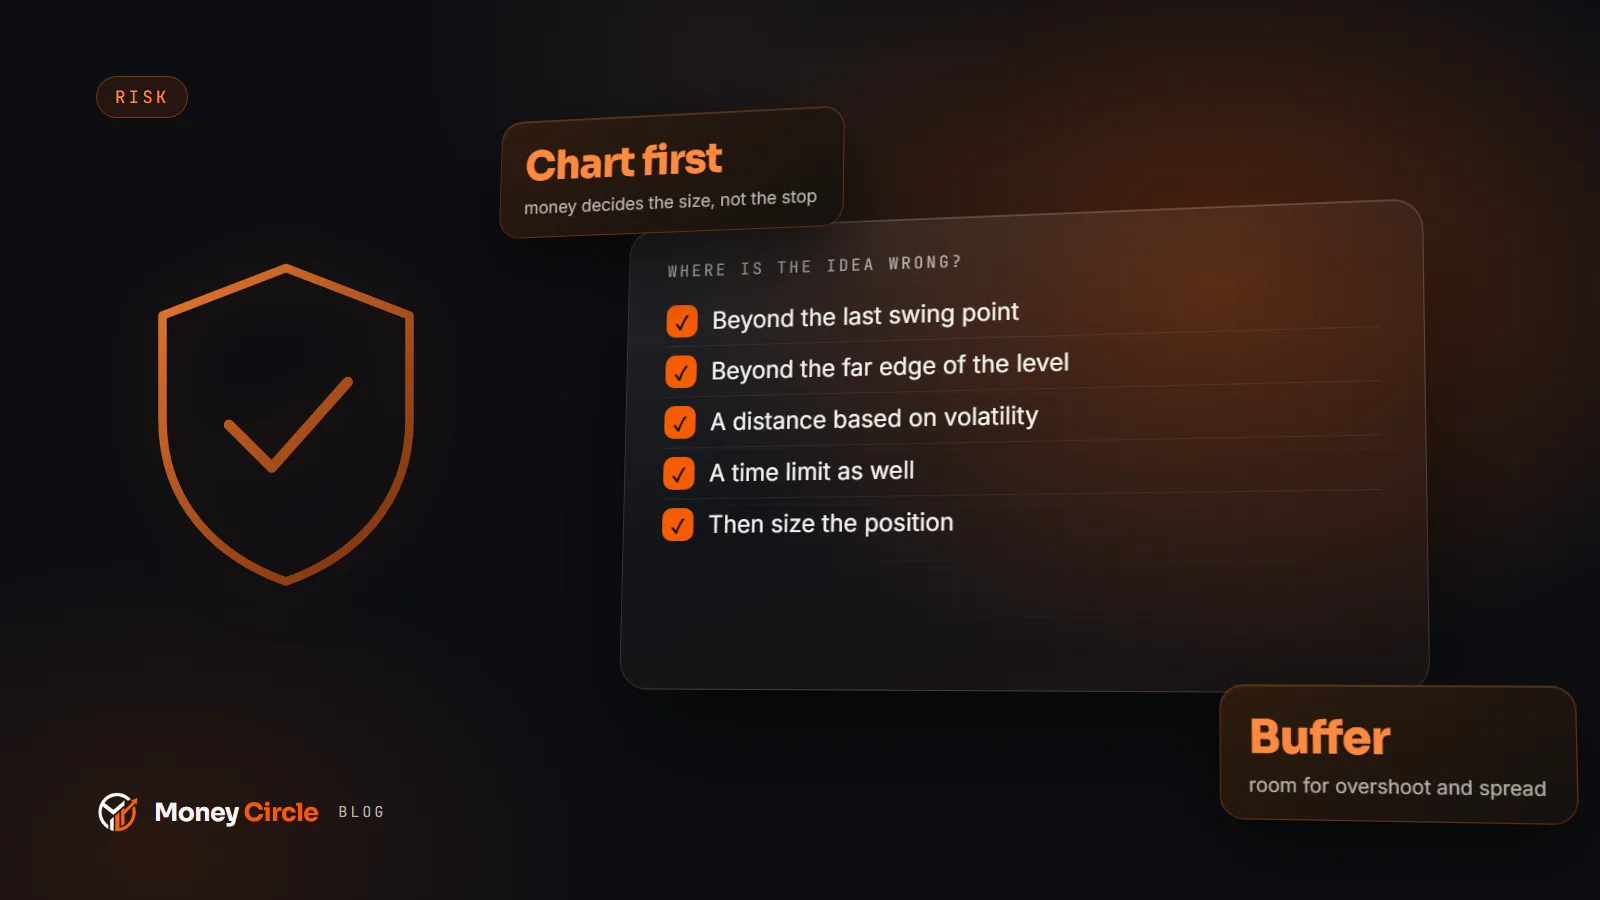
The honest way to set a target is to start from the chart, not from the ratio. Where is the next level that price has reacted to before? Is there a prior swing high or low, a round number, a clear area of congestion? Place the target where the market gives you a reason, and only then work out the ratio. If the ratio is too low to be worth the risk, the answer is not to move the target. The answer is to skip the trade.
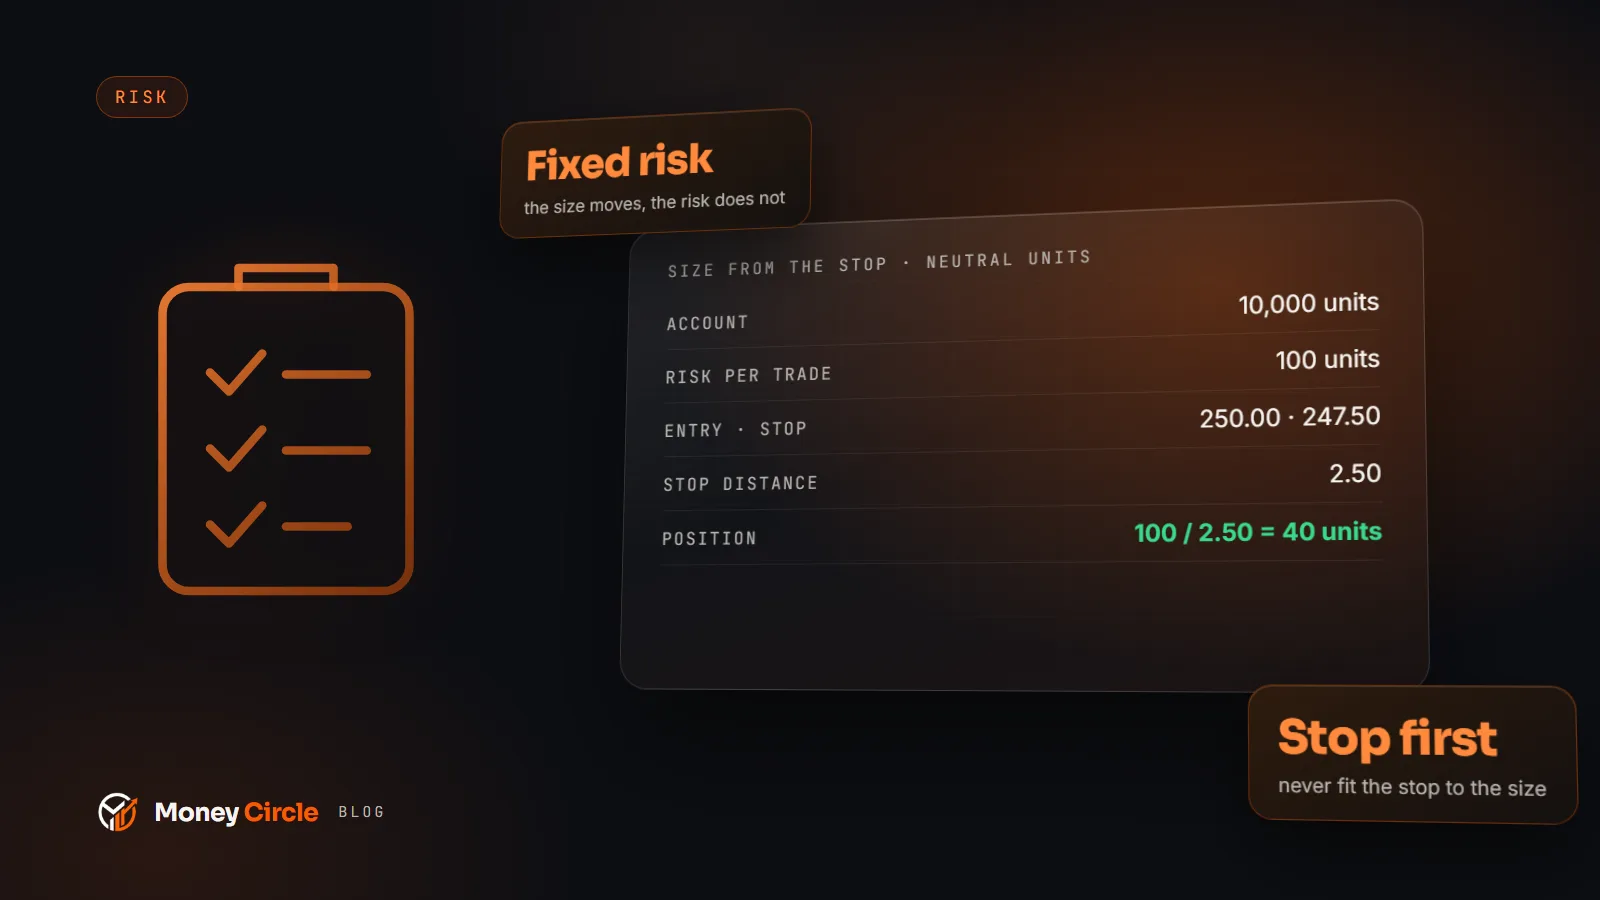
The same goes for the stop. Shrinking the stop to make a trade fit a ratio is a way of fooling yourself, because a stop that sits inside normal noise is likely to be hit for no reason. Our guide to position sizing covers how the stop distance feeds the size of the trade, and why the stop should come from the chart first.
How to use the ratio in a plan
A practical use is a minimum. Your plan can say: "I only take a trade if the nearest sensible target is at least a set multiple of my stop distance." The multiple is yours to choose, and you should test it against your own records instead of copying a number from a video.
Then add three habits:
1. Write the ratio down before entry. Put entry, stop, target and ratio in your journal or plan before you place the order. If you cannot fill in all four, you are not ready to trade. 2. Record the realised result in R. After the trade, note whether it was 1R, minus 1R, or something in between because you moved the stop or closed early. Over time, your journal shows your real average win and average loss. 3. Compare plan and reality. If your plans say 1:2 but your realised winners average well under that, you are probably closing early. That is a behaviour problem you can fix, and the journal is how you find it. See what to record in a trading journal for a simple layout.
Common mistakes
- Treating the ratio as a signal. A good ratio does not make a trade good. It only means the arithmetic is fair if the idea is sound.
- Moving the stop after entry. Widening a stop changes your risk after the fact and breaks the ratio you planned. Decide before, then honour it.
- Ignoring partial exits. If you close half at a first target and move the stop on the rest, your effective ratio changes. Write that rule into the plan instead of improvising.
- Mixing up ratio and risk per trade. The ratio compares distances. How much money you risk per trade is a separate decision, covered in how much should you risk per trade.
- Copying someone else's number. A fixed ratio that suits a scalper on a one-minute chart may be wrong for a swing trader on a daily chart.
A short checklist
Before you enter, answer in writing:
- Where exactly is my stop, and what chart reason put it there?
- Where is the target, and what reason put it there?
- What is the ratio, and is it above my minimum?
- At that ratio, what win rate do I need to break even, and does my record support it?
- Have I allowed for spread and other costs?
Keep it in proportion
The risk-reward ratio is one of the simplest tools in trading and one of the easiest to overrate. Use it to reject trades that pay too little for what they risk, to keep your targets honest, and to measure your real results in R. Do not use it to justify a trade you already want to take.
If you want to practise with a structure, the Money Circle Academy has lessons on planning a trade, and our trading plan template has a line for exactly this check.
Trading involves risk of loss; a favourable ratio does not guarantee a profitable trade, and this is educational content, not financial advice.
Educational content, not financial advice. Trading involves risk of loss.
Learn it, log it, review it on Money Circle
Included with every paid Money Circle membership: Trader Reflect and 2 ChartViews AI analyses a day.
Guides
Continue in the ecosystem
 ChartViews AI
 Trader Reflect
More from the Money Circle Blog
Get the free Trading Plan Template
A printable plan with your rules, risk and review routine, plus the weekly market outlook by email. Unsubscribe anytime.