

Risk of ruin is the probability that a run of losses takes your account down to a level you cannot accept, whether that is a funded-account limit, the point where you would stop trading, or zero. It depends on four things you control or can measure: how often you win, how much a winner earns compared with a loser costs, how much you risk per trade and where ruin begins. The calculator below combines them with a standard formula. It is free with a Money Circle account and runs in your browser.
Create a free account to use the calculator
The explanation below is public. The risk of ruin calculator comes with a free Money Circle account.
Free. No card needed.
 Sample data
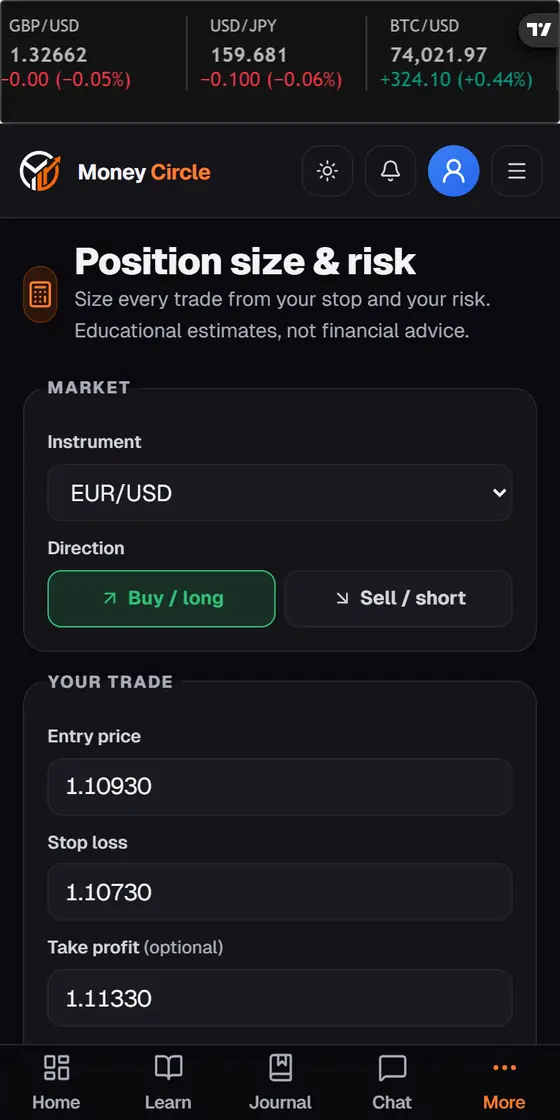
Screens from the website on a phone. Education, not financial advice. Trading involves substantial risk of loss.
Read the full guideEvery section of this page
What the number means
If the calculator shows 8 percent, then in the simplified model below about 8 out of 100 traders with exactly these numbers would, over an unlimited number of trades, at some point lose the amount you set as the threshold. It does not say that you will, and it does not say when. It is a way to compare choices: the same strategy at 1 percent risk per trade and at 5 percent gives very different answers, and seeing that gap is the point of the tool.
The formula and where it comes from
The calculator uses the classical gambler's ruin result for a random walk with unequal steps (Feller, An Introduction to Probability Theory and Its Applications, volume 1, chapter XIV). Measure your cushion in units of risk: the ruin threshold divided by the risk per trade, so a 50 percent threshold at 2 percent risk is 25 units. With a win probability p, a loss probability q and a winner that earns R times what a loser costs, find the number x between 0 and 1 that solves p times x to the power (R + 1), minus x, plus q, equal to zero. The risk of ruin is x to the power of your units.
When R is 1 the root is simply q divided by p, which gives the textbook formula. A worked example with made-up numbers: a 55 percent win rate, R of 1 and a cushion of 10 units gives (0.45 divided by 0.55) to the power 10, about 13.4 percent. If the expectancy, which is p times R minus q, is zero or negative, the result is 100 percent, because a method that loses on average eventually runs out.
How to use it
Take your win rate and average reward-to-risk from your journal rather than from hope. Enter the risk you take on each trade as a percentage of the starting balance, and set the threshold to the loss you could not accept. Then change one input at a time. Halving the risk per trade does far more for the result than a small improvement in win rate, which is why position sizing is the first line of defence.
- Win rate from 1 to 99 percent and reward to risk from 0.1 to 20, so absurd inputs are refused.
- Risk per trade from 0.1 to 25 percent of the starting balance, held fixed in money.
- A ruin threshold from 5 to 100 percent of the account.
- The expectancy per trade and the number of losses in a row that would reach the threshold.
What the model leaves out
It assumes every trade is independent, the win rate never changes, every winner pays exactly R and every trade risks the same money. Real markets break each of these. Losses cluster, edges fade, spreads and slippage cost more than planned, gaps skip stops, and people change their size after a loss. Your measured win rate from a few dozen trades is also only an estimate, and a small sample can flatter it badly.
For a non-integer R the formula is an approximation, because a winner can overshoot the line. Use the figure as a guide to the direction of change, not as a precise probability. It is an educational estimate, not advice.
Reducing it
The levers are the same ones every risk plan uses: risk less per trade, keep a positive expectancy that you have checked on enough trades, avoid stacking correlated positions that behave like one big bet, and set a daily or weekly loss limit that stops a bad run early. The drawdown recovery calculator shows what a deep loss would demand of you afterwards.
Frequently asked questions
What is risk of ruin in trading?
It is the probability that your account falls to a threshold you define, such as a loss limit or zero, given your win rate, reward to risk and the share of the account you risk per trade.
What is a good risk of ruin?
There is no figure that suits everyone. Lower is safer, and many traders aim for a result close to zero by keeping risk per trade small. Decide in advance what you can accept and check it against your own numbers.
Why is the result 100 percent for my numbers?
Your win rate and reward to risk have no positive expectancy. A method that loses on average will, over enough trades, reach any loss threshold.
Does a low risk of ruin mean I cannot lose?
No. It is a probability inside a simplified model. Real trading has costs, gaps, streaks and behaviour that the model ignores, and trading carries a high risk of loss.
Which formula does the calculator use?
The gambler's ruin result for unequal payoffs, found in Feller's probability text. For a reward to risk of 1 it reduces to (q divided by p) to the power of the number of risk units.
Test your risk before the market does
Register free to open the calculators and the journal in the member area.
Educational content, not financial advice. Trading foreign exchange, CFDs and cryptocurrencies carries a high level of risk and may not be suitable for everyone. You can lose more than you expect, and past performance does not guarantee future results. Only trade with capital you can afford to lose. Disclaimer.