

How to Backtest a Trading Strategy by Hand, Step by Step
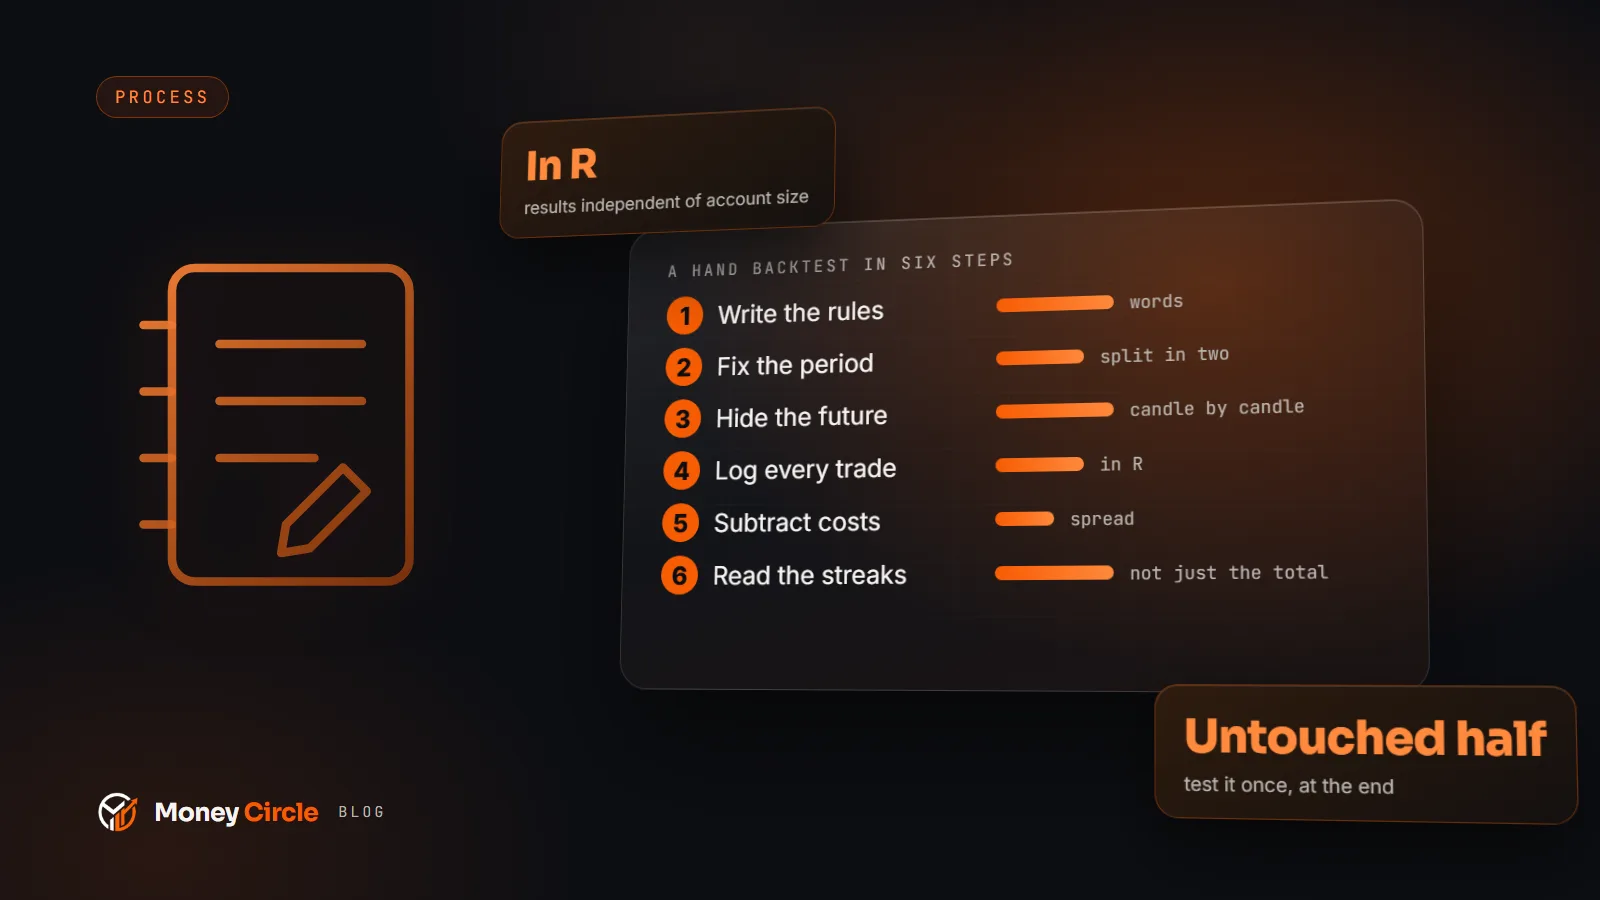
Manual backtesting needs only a chart, a spreadsheet and strict rules. Learn how to test an idea honestly and avoid fooling yourself.
Backtesting means testing a trading idea on past data to see how it would have behaved. Software can do it in seconds, but doing it by hand has one big advantage for a beginner: you see every trade, you understand exactly why the rules produced it, and you cannot hide behind a tidy number you do not understand.
This guide shows how to backtest a simple strategy manually with a chart and a spreadsheet. It will not tell you whether a strategy makes money in the future. No test can. What it can do is tell you whether your rules are clear, whether they behave sensibly in different conditions, and whether the idea is worth testing further in a demo account.
Why do it by hand
Manual testing forces three useful things on you:
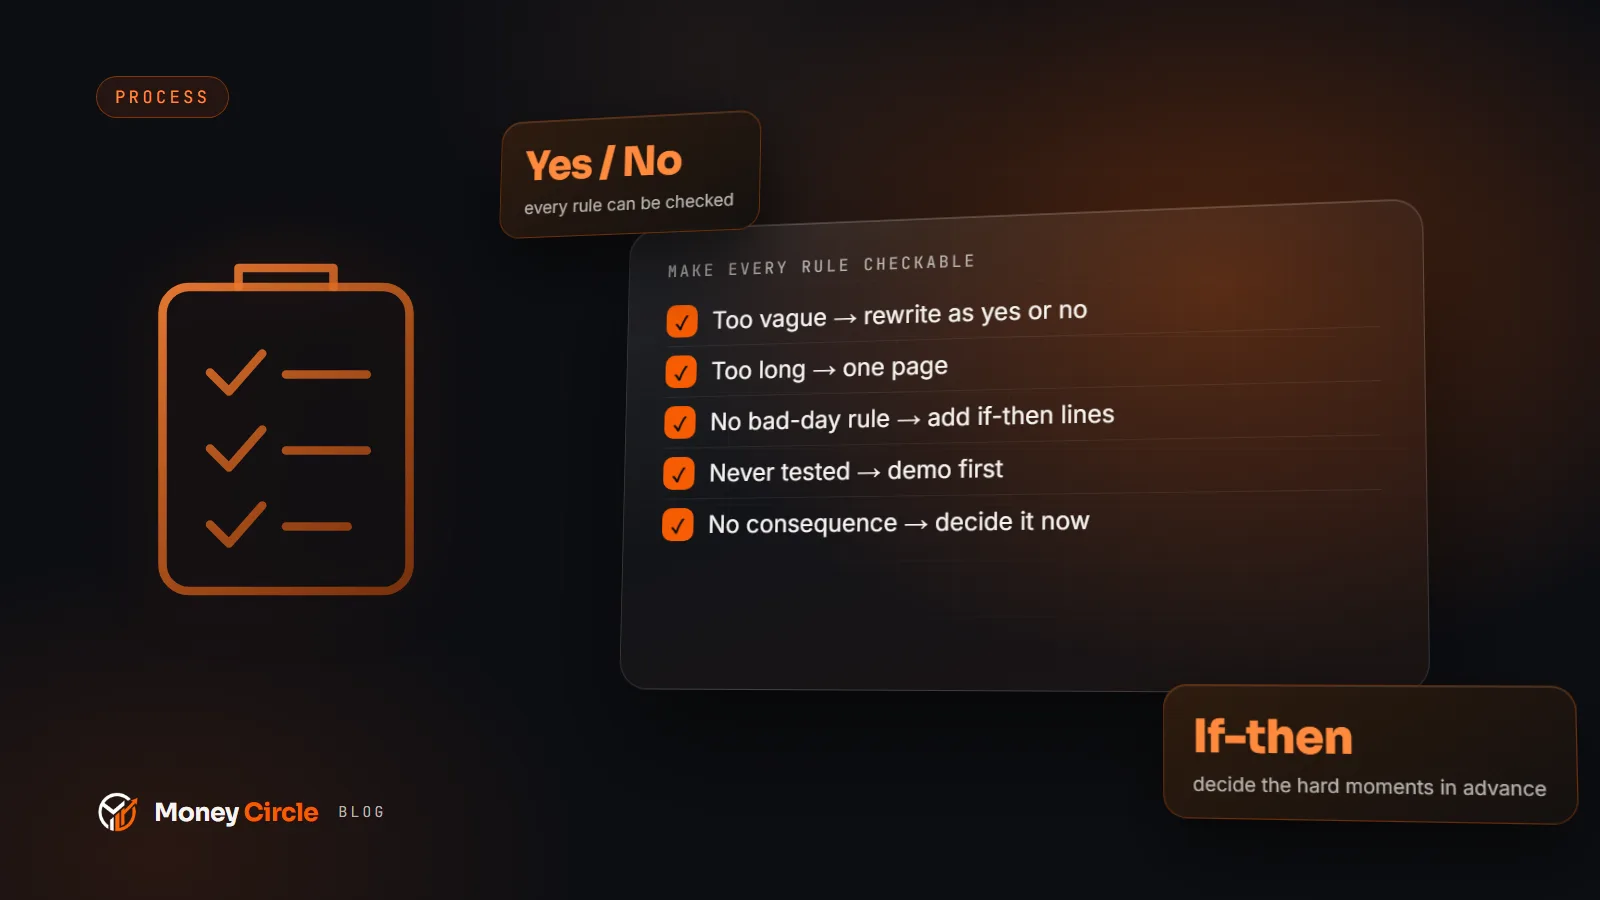
- Clear rules. If you cannot decide on a chart whether a setup counts, the rule is vague. Software only tests rules you can code. Doing it by hand exposes the vague ones.
- Familiarity. Scrolling through a few dozen examples teaches you what the setup looks like in good and bad conditions, which no summary table can.
- Honesty. You see the losing streaks and the dull stretches. A good-looking total can hide a path that you would never have survived emotionally.
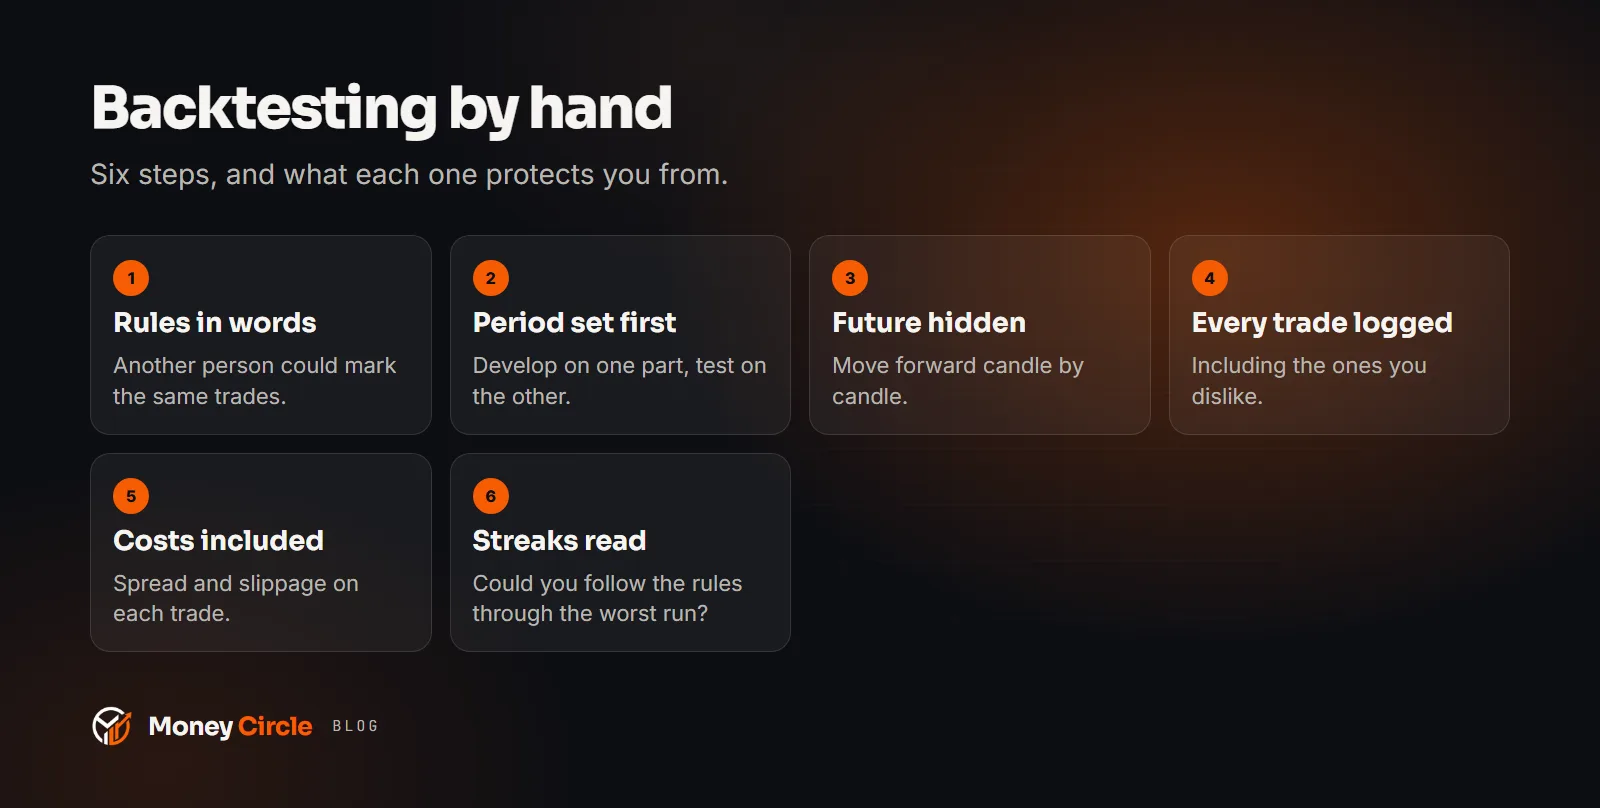
Step 1: write the rules in full sentences
Before you open a chart, write the strategy down. It needs these parts:
- Market and timeframe. One market and one timeframe for the test.
- Setup condition. What must be on the chart before you consider a trade.
- Entry trigger. The exact event that makes you enter.
- Stop-loss rule. Where it goes, in words you can apply the same way each time.
- Exit rule. Where you take profit or close, including what happens if neither the stop nor the target is hit.
- Filters. For example, sessions you skip or periods around scheduled news.
Step 2: set the test period before you look
Choose how far back you will test and decide it in advance. Pick a period long enough to include different conditions: trending stretches, ranges and quiet weeks. If you only test during one kind of market, you only learn about that kind.
A useful habit is to split the period in two. Develop and adjust the rules on the first part. Keep the second part untouched, and test on it only once at the end. If the rules only work on the part you shaped them on, they are probably fitted to noise.
Step 3: hide the future
The biggest danger is looking ahead. If you can see what price did next, your brain will bend the rules to fit. Cover the right-hand side of the chart, or use a replay function if your platform offers one, and move forward candle by candle.
At each candle ask only: do my written rules say to enter now? If yes, record the trade at the price the rules would have given you, not at a better one you can see in hindsight. Then continue forward until the stop or the target would have been reached.
Step 4: record every trade in a spreadsheet
Make one row per trade with these columns:
- Date and time
- Direction
- Entry price
- Stop price
- Target price (or exit rule)
- Exit price
- Result in R (the multiple of the amount risked: minus 1R for a full stop, 2R for a gain twice the risk)
- Notes on conditions and any doubt about the rule
Include every trade the rules called for, including the ones you dislike. Skipping the ugly ones is the quickest way to ruin a test.
Step 5: include costs
A test without costs is flattering. Subtract a realistic spread from every trade, and a commission if your account charges one. Where your rule uses a stop, assume the exit can be slightly worse than the stop price. Use the costs you actually pay, not an optimistic guess. For a short-term strategy with small stops, costs can decide the whole result.
Step 6: read the results
When you have enough trades, summarise:
- Number of trades. A handful of trades proves nothing. Aim for as many as you can manage, and treat a small sample as a rough sketch.
- Win rate and average win and loss in R. Together they give the average result per trade, called expectancy. If the average is negative after costs, the idea needs work.
- Longest losing streak. This is the number most people forget. Ask honestly whether you would keep following the rules through that streak. If not, the strategy does not fit you, whatever the total says.
- Worst drawdown. The largest fall from a peak in your running total, measured in R. Compare it with the loss you can tolerate.
- Spread of results. Check that one lucky trade is not responsible for the whole outcome.
Common ways to fool yourself
- Hindsight. Entering where the trade turned out to work, not where the rules said.
- Curve fitting. Adding rules until past trades look good. Each extra rule that exists only to remove one losing trade makes the future result less reliable.
- Cherry-picking periods. Testing only a stretch that suits the idea.
- Ignoring the second half. Adjusting after seeing the untouched data means it is no longer untouched.
- Overconfidence from a small sample. A good run of twenty trades can be luck.
What to do next
If the rules survive the test, the next step is not live trading with real size. It is a period of forward testing in a demo account, which checks the strategy on data you could not have seen, and checks whether you can execute it. We compare that route with going live in our piece on demo and live accounts.
Keep the spreadsheet. When you later change a rule, repeat the test for the new version instead of trusting a feeling. If you want guidance, the Money Circle Academy has lessons on turning an idea into a rule set, and our trading plan template gives you a page to write it on.
Trading involves risk of loss; past test results do not predict future performance, and this is educational content, not financial advice.
Educational content, not financial advice. Trading involves risk of loss.
Learn it, log it, review it on Money Circle
Included with every paid Money Circle membership: Trader Reflect and 2 ChartViews AI analyses a day.
Guides
Continue in the ecosystem
 ChartViews AI
 Trader Reflect
More from the Money Circle Blog
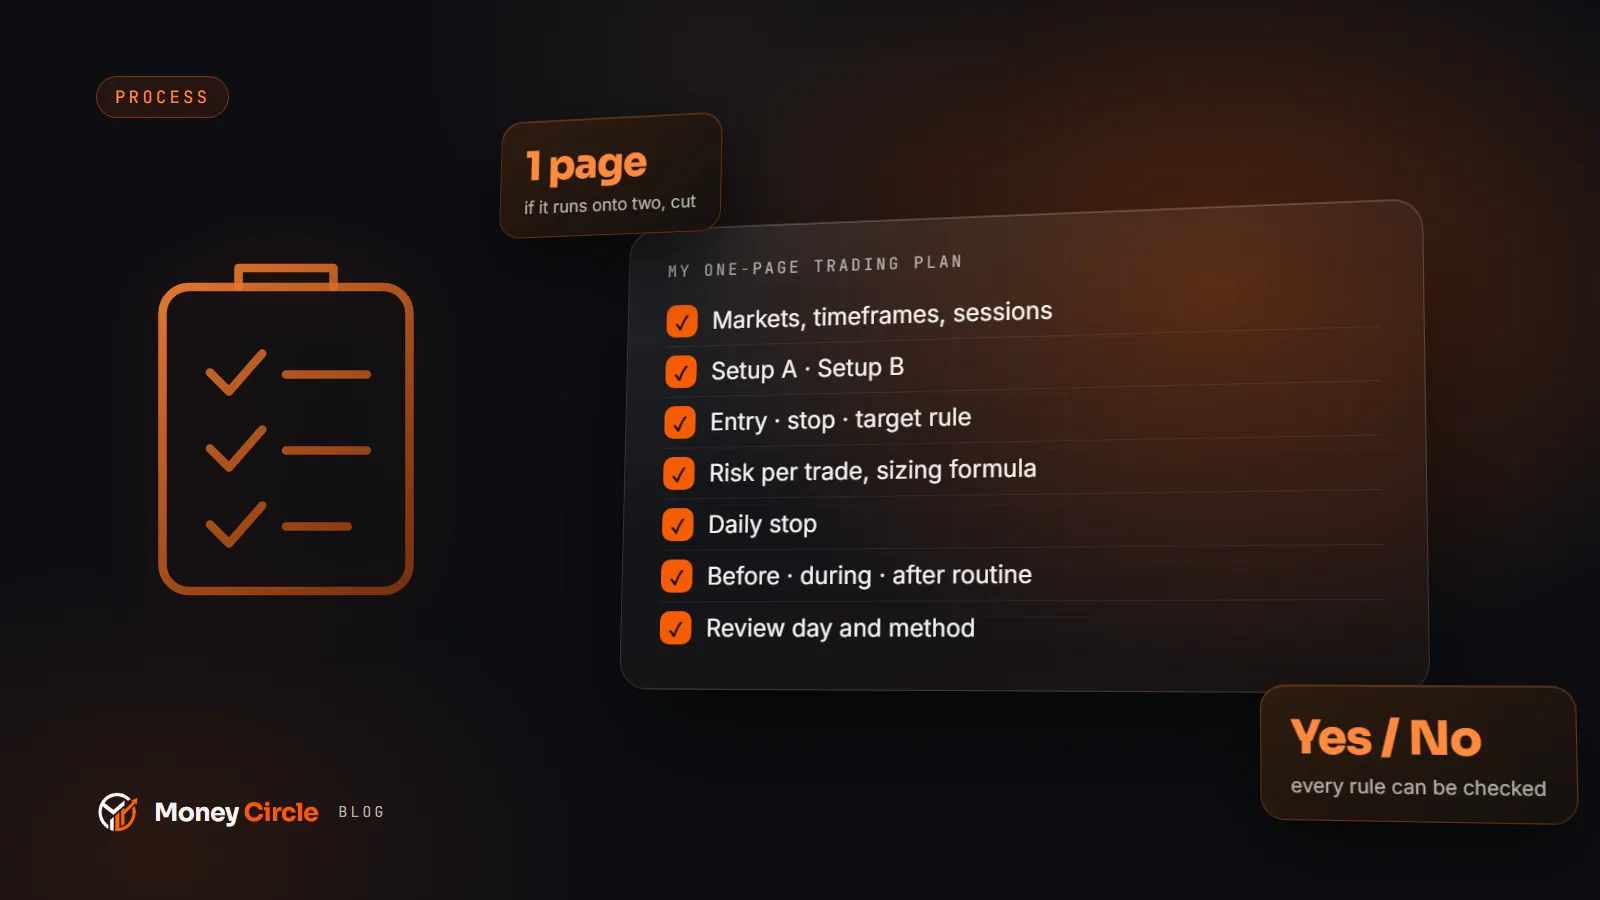
Get the free Trading Plan Template
A printable plan with your rules, risk and review routine, plus the weekly market outlook by email. Unsubscribe anytime.